Abstract
Eye-tracking technology is a biometric tool that has found many commercial and research applications. The recent advent of affordable wearable sensors has considerably expanded the range of these possibilities to fields such as computer gaming, education, entertainment, health, neuromarketing, psychology, etc. The Visual Attention Software by 3M (3M-VAS) is an artificial intelligence application that was formulated using experimental data from eye-tracking. It can be used to predict viewer reactions to images, generating fixation point probability maps and fixation point sequence estimations, thus revealing pre-attentive processing of visual stimuli with a very high degree of accuracy. We have used 3M-VAS software in an innovative implementation to analyze images of different buildings, either in their original state or photographically manipulated, as well as various geometric patterns. The software not only reveals non-obvious fixation points, but also overall relative design coherence, a key element of Christopher Alexander’s theory of geometrical order. A more evenly distributed field of attention seen in some structures contrasts with other buildings being ignored, those showing instead unconnected points of splintered attention. Our findings are non-intuitive and surprising. We link these results to both Alexander’s theory and Neuroscience, identify potential pitfalls in the software’s use, and also suggest ways to avoid them.
1. Introduction
Visual Attention Software by 3M Company (3M-VAS) is an artificial intelligence application that was formulated using a large quantity of eye-tracking experimental data, and it can be used to predict initial viewer reactions to images. Scans generate fixation-point probability maps and fixation-point sequence estimations, and thus reveal pre-attentive, or “unconscious” processing of visual stimuli with a very high degree of accuracy [1]. The software’s originally conceived applications were related to product design, advertisements, signage, unconscious user attraction, etc. We envision that this could soon become a very popular tool to evaluate and improve the design of the built environment.
Here, we expand on the findings of a recent pilot study using 3M-VAS by two of the authors [2], by analyzing many images of different buildings, either in their original state or photographically manipulated, as well as geometric patterns and sketches. We find that the software reveals significant differences between buildings that are compared side-to-side using scans: their façade immediately fixated upon, with the eye drawn by overall design coherence, versus others that are avoided, with the eye drawn beyond the façade’s edges.
The visual mechanisms apparently at play here are fundamentally related to the mathematical coherence (organized complexity) of the design. This quality is a key element of Christopher Alexander’s theory of geometrical order, in structures that possess it [3]. We present and discuss these findings, giving sufficient background for readers who are not familiar with Alexander’s work. We also identify potential pitfalls in the use of the software and ways to avoid them. Our goal is to help establish unconscious viewer engagement as a new paradigm for adaptive design. This can be achieved in practice using direct eye-tracking sensors, virtual reality eye-tracking, or any of several eye-tracking software simulations available on the market. Those developments come from commercial design, not from architecture. Here, we used 3M-VAS and would like to optimize its usefulness for architectural design applications, and to encourage its universal adoption as a practical tool to promote healthful, human-centric design.
The ability to predict a user’s engagement with a building’s design (as experienced first of all in its façade) is a key factor to its everyday use. We can predict attachment based on unconscious eye fixations. Although this technique does not detect anything that has to do with emotion directly, adding preference testing such as facial expression analysis and other similar metrics combined with visual attention can indicate if attachment was negative or positive. The detection framework of eye-tracking or visual attention software estimates the immediate, “at-first-glance,” real-world impact of architectural design, something that has to date eluded architectural analysis. As the world becomes more concerned with sustainability of the built environment, the ability of software to anticipate human behavior becomes increasingly important for the building and design industries.
Eye-tracking also reveals the mathematical property of nested symmetries (or relative coherence, explained below) in an effortless manner. This quality is a key element of Alexander’s theory, and although visual attention can certainly be analyzed without reference to it, linking the results coming from actual eye tracking or simulation software to a deeper theoretical rubric strengthens the analysis. In moving towards a greater degree of “life” (as defined by Alexander in reference [3]), a design or structure acquires increasing coherence. Simple eye-tracking simulation experiments using 3M-VAS software reveal that a region focuses a viewer’s attention in a more unified—more evenly distributed manner. Unconnected attention-seeking “hotspots” tend to disappear as the geometrical coherence increases.
This experimental result supports a recent understanding of fractally based human cognition (ordered geometrical structure on a hierarchy of scales) [4,5,6,7,8]. Evolution has prepared us to input information on distinct linked scales, as for example in the nested symmetries of a fern leaf. The 3M-VAS software shows the desired result of coherence as a uniform “blue glow”: every square millimeter of a visual draws attention. This response is characteristic of most natural forms, and certainly of living forms; yet the emotional experience that follows it could either be positive or negative and fearful (for example, seeing a Lion’s face). In both cases, the presence of coherence promotes easy computation. Whether the result of this computation will be a fear response, or subsequent attraction, depends on the specific stimulus.
It would appear that this coherent state of unconscious human interest satisfies a deep neurological need. However, an almost evenly distributed visual interest should not be confused with a uniform but empty design, where no point draws the eye’s attention, and the scan instead deflects to the corners or periphery of the image. These two distinct situations represent two opposite states of the subliminal reality of a viewer’s engagement: empty and dead (showing a sizable hole in the 3M-VAS scan, which the gaze avoids), versus intense and full interest (showing an extended and uniform coverage, with no holes and few if any red hot-spots in the 3M-VAS scan).
The apparent uniformization of unconscious visual interest in an intensely coherent structure is remarkable, because the designs exhibiting this property are anything other than uniform. Organic designs are highly complex, full of contrast and details. What Alexander labels as the “field of centers” is the result of a high degree of organized complexity. A visual’s overall coherence leads to intense yet uniform visual interest. This result is both important and unexpected. It is also a new discovery. Furthermore, this understanding establishes the link that now permits us to use visual attention software to test for coherence in a design.
Starting today, designers have at their disposal a technique of unprecedented power to design environments good for human health. Through advanced machine learning and vision science, we have finally realized Alexander’s dream of connecting the material world to the subliminal world, and thus to be able to consciously shape the latter. This paper works with essentially two complementary ideas that reinforce each other. Our experiments and interpretation could be read as a practical guide on using 3M-VAS software to analyze architectural and urban environments. We show how knowledge of the neuroscience of our visual perception system can be used to reveal some of the ways that architecture affects the user. This extremely powerful tool reveals how people have an innate form bias that directs us subliminally, and which we cannot control. Actual eye tracking and simulation software distill the neuroscience that today’s architects and planners do not yet know.
The other component of this paper describes how Christopher Alexander predicted how the brain responds to buildings and design 40 years ago, but no one at that time cared to listen. While this part of the discussion could have been left to a separate paper, we are convinced of the importance of anchoring the present revolutionary method of design diagnosis on a deeper theoretical ground. The software is sensitive to the same parameters that our visual system is sensitive to, when performing pre-attentive processing. Yet we would not want readers to imagine an invented explanation of what a piece of software developed through machine learning is doing, and whose scientific basis they do not need to comprehend. As with all such powerful tools, it is important to attach an explanatory basis to the tool itself, to prevent it from being misunderstood and misused, and here we have sought to do this from two different perspectives.
2. Using the 3M-VAS Software
A brief explanation of how to use the 3M-VAS software is included here for interested readers. The software is accessed through the 3M-VAS webpage [1]. One uploads an image, then selects one of nine modalities of analysis, among, for example, “Packaging”, “Signage”, “Webpage”, etc. We chose to use the category “Other” as the most general and unbiased mode for analyzing our images. Scan analysis is performed fully automatically in a few seconds, then the results can be downloaded. There are no parameters to adjust. The complete report shows the Heatmap, Hotspots, Gaze Sequence, and Visual Elements (see Figure 1 below). Section 7 of this paper lists tips for optimizing the images before scanning so as to avoid unwanted artifacts.
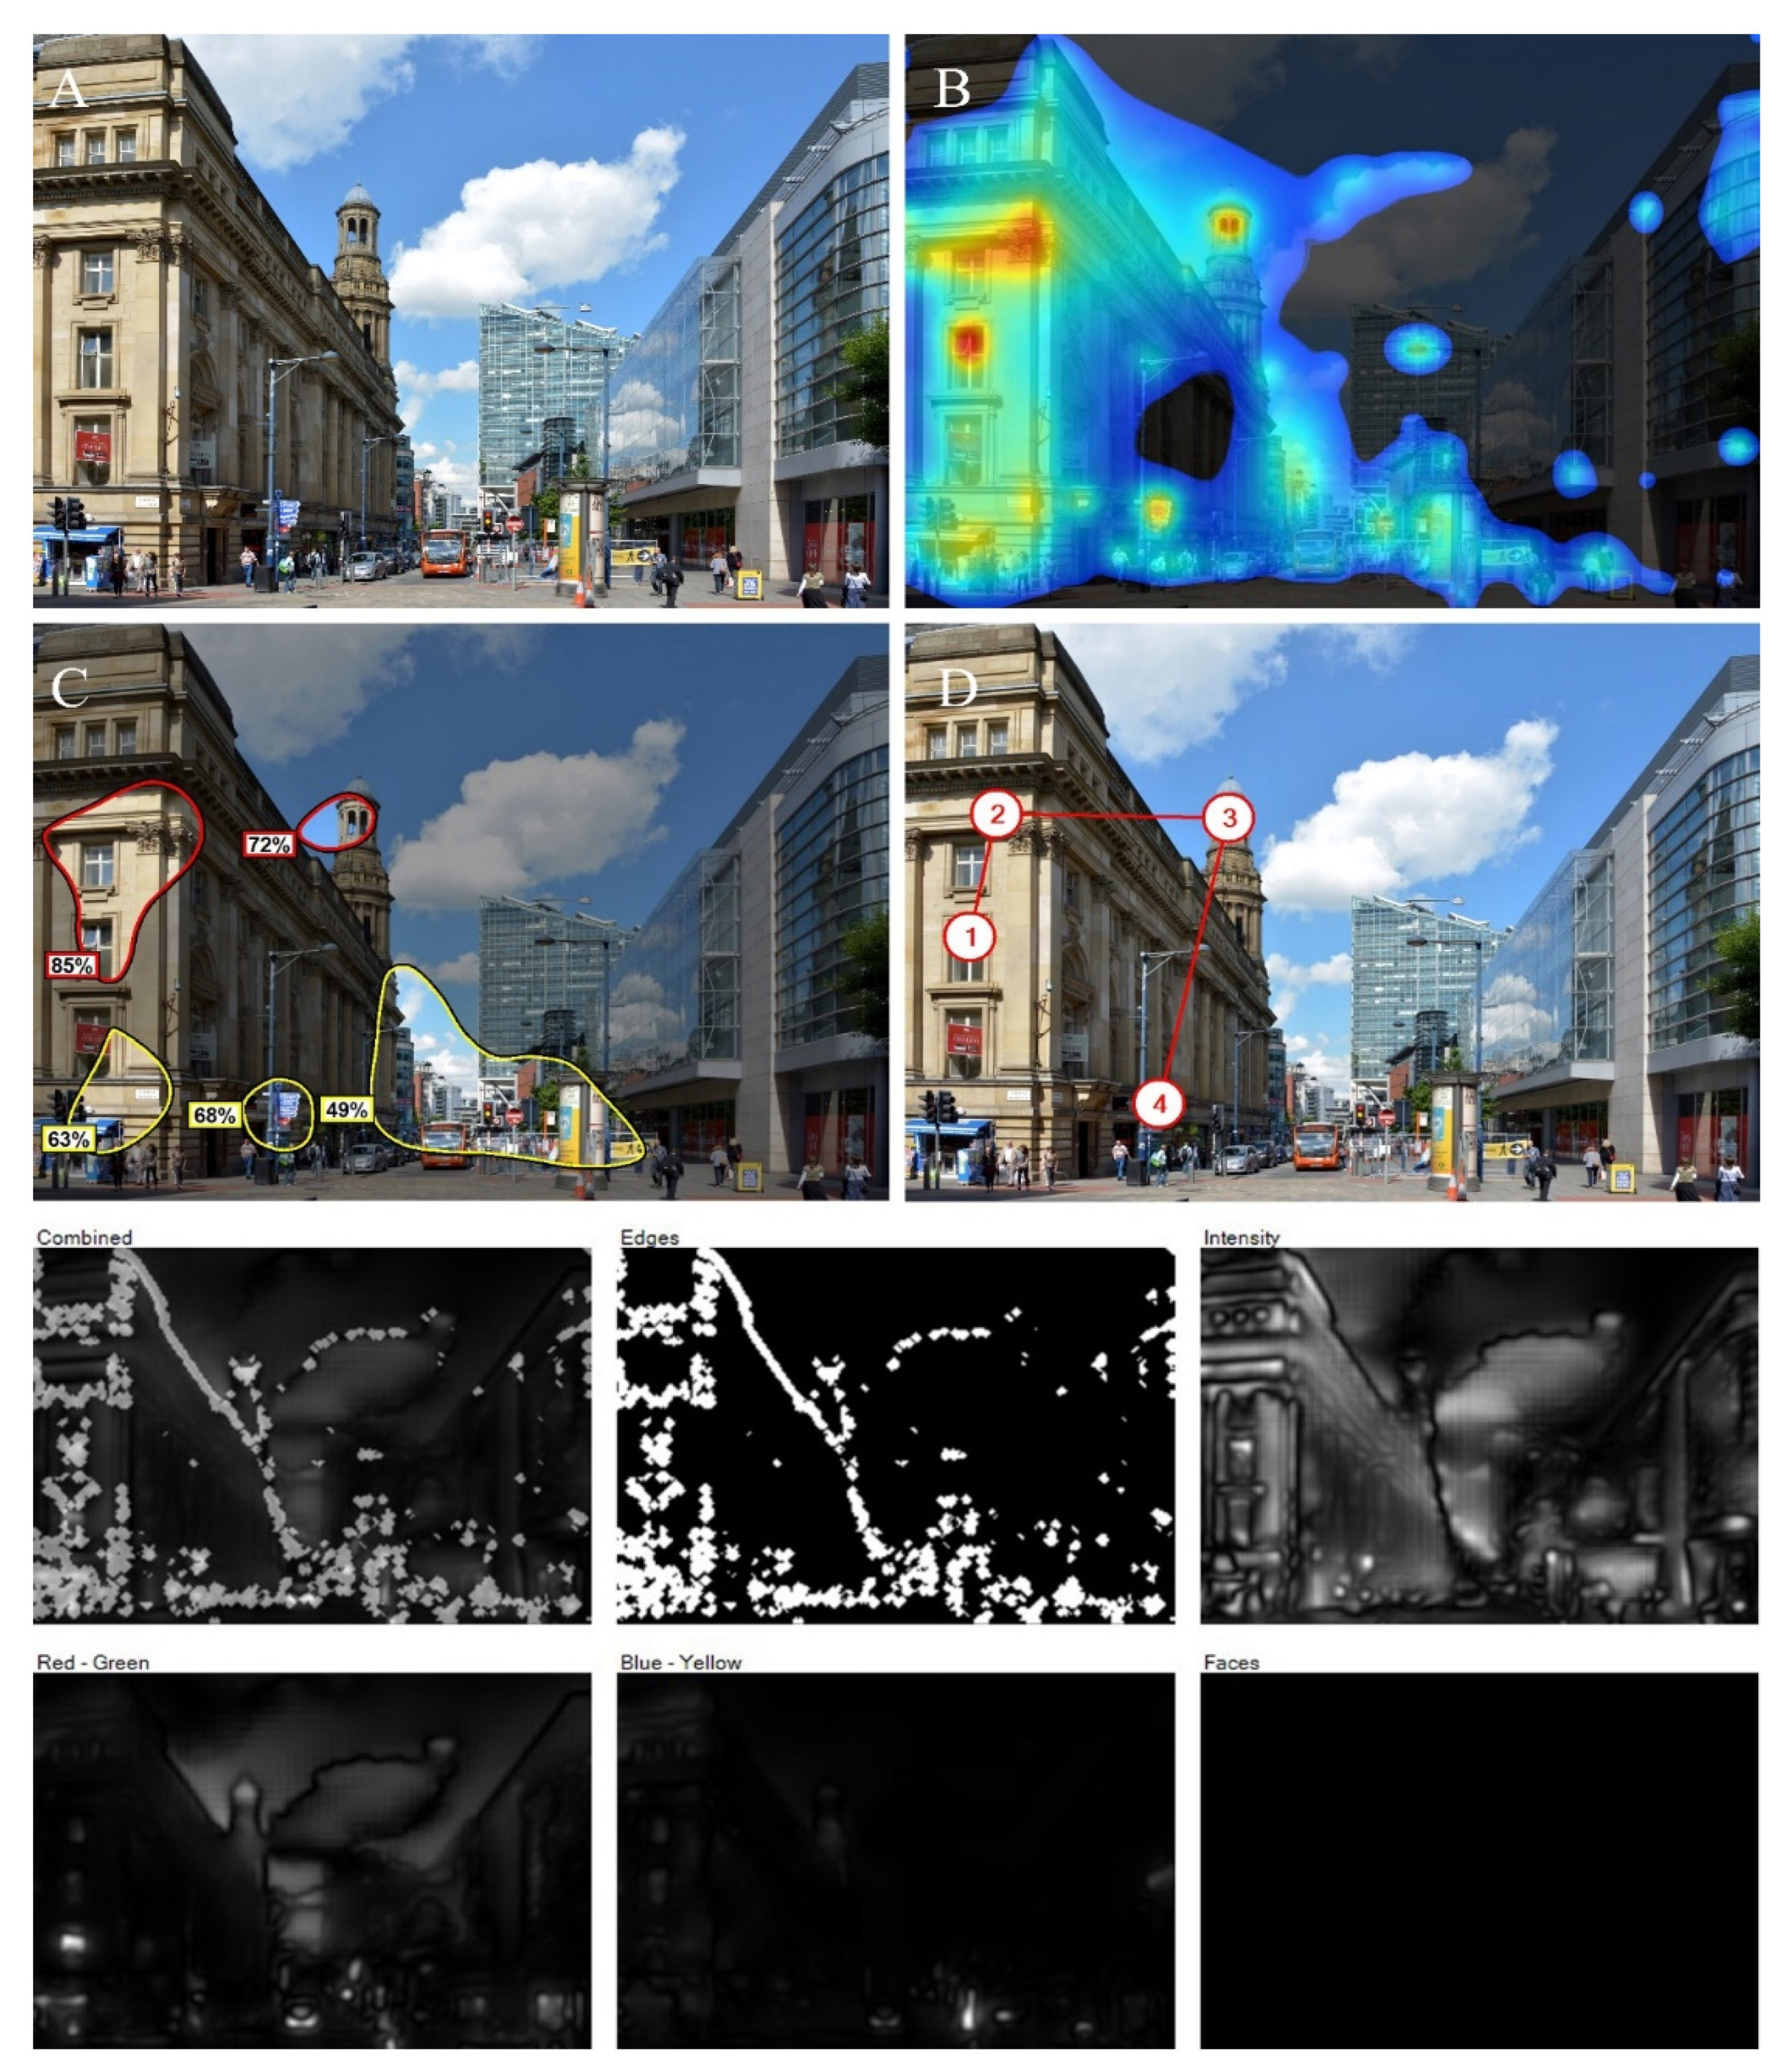
Figure 1. Image from the center of Manchester, UK, at the junction of Market and Cross Streets, with the full analysis output of the 3M-VAS software. (A): Original image. (B): Heatmap. (C): Simplified version of the heatmap results, showing only areas that are most likely to be seen within the 3–5 s first glance time period. (D): Gaze sequence of the four most likely gaze locations, in their most probable viewing order. The bottom six images register the 3M-VAS simulation of human pre-attentive gaze determining factors: edges, intensity, red/green color contrast, blue/yellow color contrast, and faces.
The authors are convinced that no human bias is involved in the visual attention scans. VAS is based on more than thirty years of research by 3M vision scientists. The artificial intelligence (AI) component of this analysis was built in by 3M corporation when creating the software, and is not observable in use. The software was trained using a very large number of actual eye-scan recordings, and 3M corporation claims a high degree of correlation between real eye-tracking studies and the in silico simulation. One of us has previously carried out direct eye-tracking experiments and found strong consistency of the present results with those obtained with optical eye-tracking [9,10,11]; we therefore feel very confident in using the 3M-VAS software as a valid tool for this type of work. (We point to possible artifacts that could arise from “casual” use, and describe conditions that have to be optimized for the predictive software to perform in an optimal manner. We do not claim that AI-based simulation completely replaces eye-tracking, but do claim that, used correctly, it can provide valuable information about our pre-attentive gaze and the factors that influence it).
Direct eye-tracking sensors and eye-tracking simulation software are independent and extremely valuable tools for analyzing the unconscious human response to visual images. This paper focuses exclusively on the software method for the simple reason that architects and designers will find it much more convenient to use. 3M-VAS is already incorporated as a plugin for computer design programs (e.g., in Adobe Photoshop software). Not every research group has access to eye-tracking apparatus, even though this is now an easy option with many lightweight and practical sensors available for use [12].
A second reason for confidence in the 3M-VAS software lies with its stated theoretical basis, which coincides with a co-author’s previous model of design complexity [13,14]. The 3M Company bases its algorithm on four visual elements verified by experiments in cognitive psychology and neuroscience. Human visual attention depends to a large extent upon elements that trigger unconscious viewing: edges—density of differentiations, or greyscale contrast; intensity of color hue; contrast among color hues—red/green and yellow/blue; similarity to a face—bilateral symmetry with fixation points roughly corresponding to eyes, nose, and mouth. The fourth element, abstract facial similarity, has been investigated at length by another co-author [15]. The face factor is a complex quality that incorporates more basic geometrical measures such as specific nested bilateral symmetries about a vertical axis. Abstract facial similarity can be codified using components of mathematical symmetry in what is defined elsewhere as the Biophilic Healing Index [8,16,17,18].
Competing eye-tracking simulation software now available for commercial use includes EyeQuant [19] and Expoze [20], two artificial intelligence eye-tracking companies. Very much like 3M-VAS, these programs predict how users will perceive a design in the first three to five seconds of unconscious viewing. An artificial intelligence approach generates eye-tracking data and heatmaps for different images and visual stimuli. We have used neither EyeQuant nor Expoze hence can make no comparisons between them and 3M-VAS. As scientists on a research mission, we welcome the availability of similar but distinct tools that different groups may use in their analysis. It is not the aim of this paper to dig into how these tools work, but to apply one of them in obtaining results that are of major interest to architects and urban designers.
At the same time, there are parallel laboratory-based research investigations into how humans perceive and interpret architecture. Some of those use virtual reality and body sensors [21,22,23]. Those studies go beyond the present limitation of purely visual engagement, since they incorporate emotional responses such as skin conductance, brain activity, and heart rate. We believe that those results are very important in interpreting the health aspects of the environment, by adding crucial physiological, emotional, and cognitive responses. One difference between those studies and ours is that we focus here on the exterior experience rather than on interior settings. Both research directions (plus other closely related efforts) are important and mutually supportive.
3. Neurological Background
Natural surroundings have been shown to exert positive effects on human health and well-being on many levels, including a reduction in stress, sometimes by the simple viewing of images [24]. These effects are to be attributed to features of their geometry, and such features are not only found in nature, but also in artificial environments, especially in pre-modern architecture of different countries, cultures, and styles. Exposure to this type of visual organization (organized complexity) may have the same positive effects, regardless of whether it is found in natural or artificial structures [6,7,8,14,15,16,17,18].
Pioneering eye-tracking work [9,10,11] has investigated pre-attentive focusing of attention in volunteers’ gazes when first confronted with different types of images, resulting in a number of interesting findings. Eye-tracking analyses immediately reveal that attention is consistently drawn to the presence of people, and to the human face in particular, with every human presence in an image of, say, a building or street scene detected fast. Another discovery is that our gaze is drawn by details, contrasts, and structures that make overall geometrical sense.
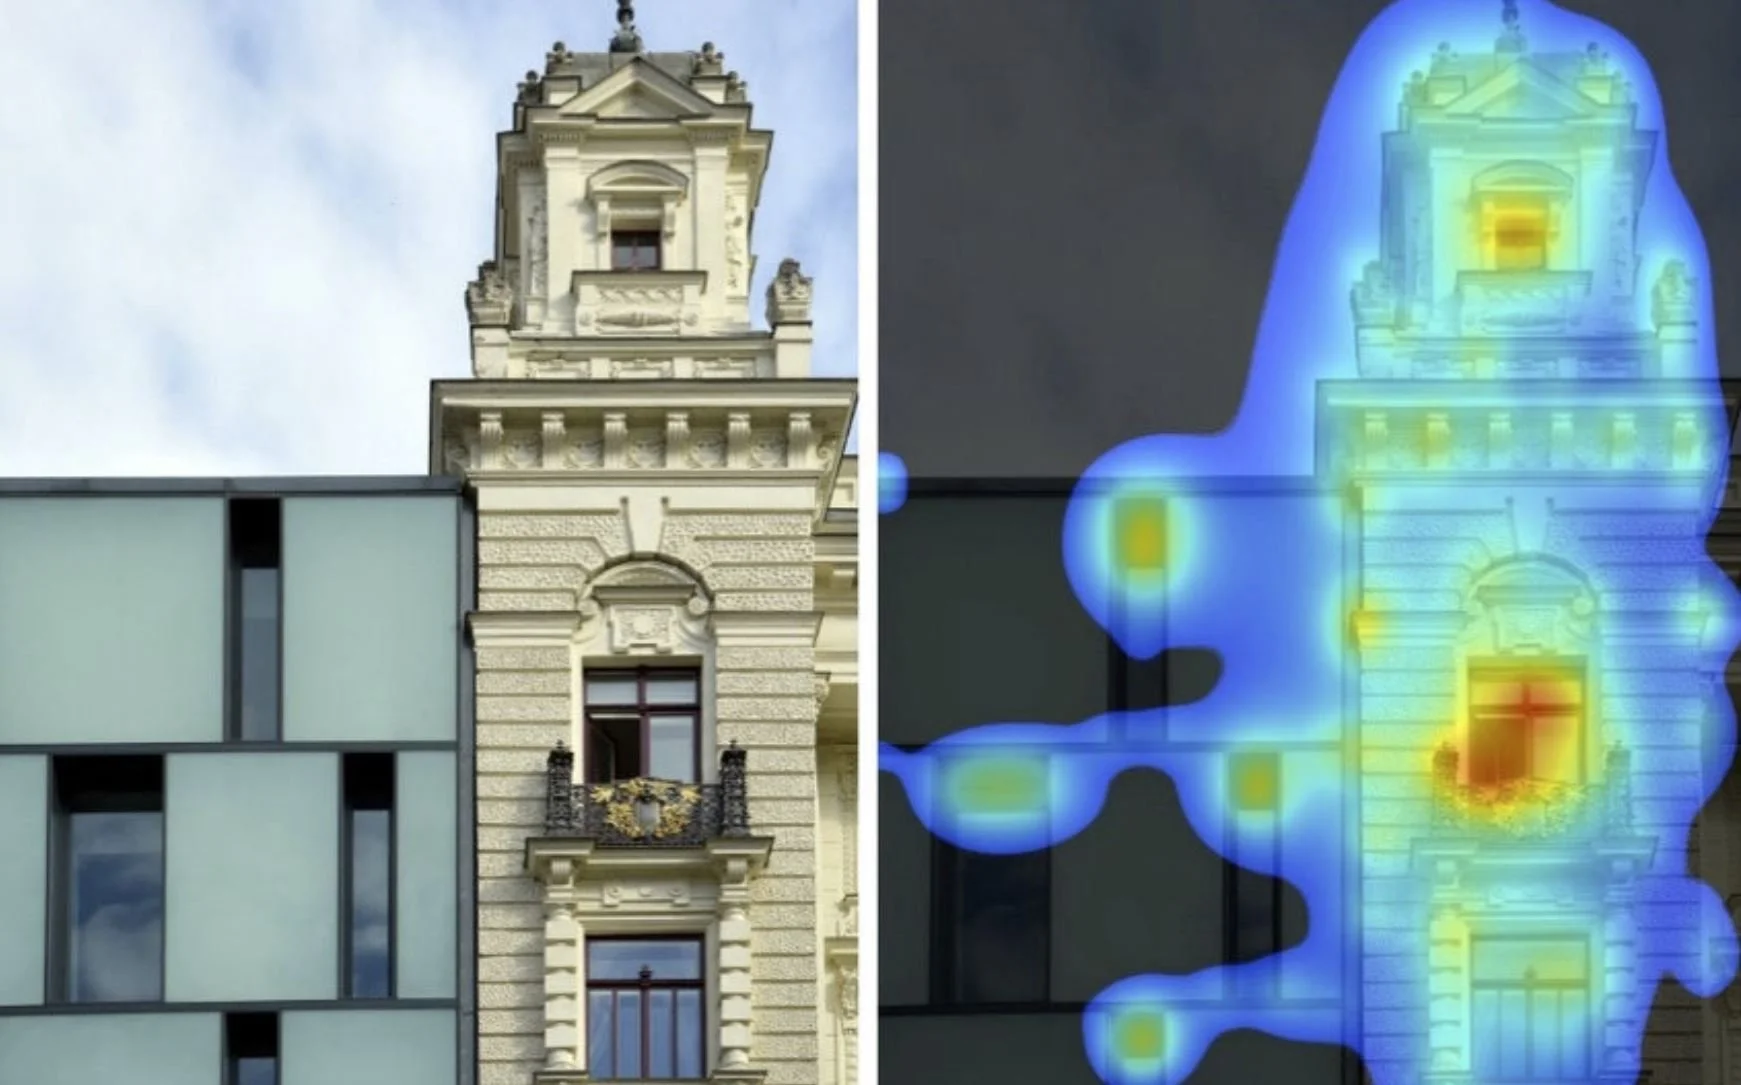
These findings have important consequences for how we experience architecture. Contemporary buildings, especially when they have plain glass facades, are explored in passing, with no clear fixation points on the building itself. This avoidance pattern contrasts with that seen in pre-modern buildings, which seem to attract attention in their entirety and also in a manner that facilitates understanding the relationship between the design’s details with the whole building. For example, viewers facing more traditional buildings can swiftly spot an entrance. Pre-attentive processing seems to attract people to focus attention on some structures, whereas it drives them away from others, or at least it makes people ignore them.
The remainder of this section reviews the neurological basis for eye-tracking, and why it is crucial for determining unconscious human actions. (Readers may skip this discussion and go directly to the 3M-VAS scans). Information transmission through the human optic nerve takes place at a very high rate, estimated as between 107 and 108 bits per second [25]. Processing all of this information fast enough to ensure timely responses that can be crucial for survival would be an impossible task without some form of selection. Indeed, our visual system has developed ways to select relevant or salient information so as to determine appropriate and adequate action and control its execution. As early as the level when an image reaches the retina (which is, embryologically and functionally, part of the central nervous system), computation οf low-level visual features is initiated, and it continues in the lateral geniculate nucleus (LGN) of the thalamus and the early visual cortical areas.
The retina itself is more than just a photoreceptor array: horizontal interconnectivity between retinal cells allows for that first level of processing, which is reflected in the relay station of the LGN, while further steps of spatial processing are taking place in the early visual cortical areas. About 10% of the retinal output takes another pathway, leading to the phylogenetically more primitive system of the superior colliculus and the pulvinar nucleus of the thalamus, responsible for early responses to motion in the peripheral visual field [26], as well as fear responses by direct input from the pulvinar to the amygdala, for example when sighting predators [27].
Neurons at these early levels of perception are tuned to respond to simple visual properties such as intensity contrast, color opponency, and, in the visual cortex, also orientation, direction, and velocity of motion, etc., (for a review see [25]). These visual features are computed pre-attentively in a parallel manner, creating an early “saliency map” [28]. These are not just feedforward processes, but are also influenced by feedback in the most advanced stages. We are describing the instinctive, unconscious mechanisms that drive immediate human responses.
As survival is so dependent on fast and appropriate response to environmental stimuli, it is to be expected that a failure of this early registration mechanism would lead to an apprehension of potential danger and stress. In general terms, environments that depart visually from our “safe” reference imprinted through human evolution will trigger anxiety. Stress has indeed already been connected to visual surroundings that are deprived of a certain level of organized complexity [29] through the mechanism of sensory input deprivation [30].
The above discussion is preparatory to presenting results on how visuals affect us. Before analyzing images in the following sections, we describe the software that we chose to use and the procedure we followed (including certain selections that have to be made). The software is easy and straightforward to use; nevertheless, after processing many images, we discovered some tricks that helped us to get a more accurate reading on the points of architectural interest. We have included those findings as tips for other researchers who might wish to try this method of analysis.
4. Materials and Methods
Twenty-nine photographic images (photographs by A.A. Lavdas, processing performed using Adobe Photoshop software), six geometrical patterns, and four pattern drawings and one Lion drawing (sketches by N.A. Salingaros) were processed using the 3M-VAS. In general, the software provides five different results of visualizations of each image as follows [1]:
Areas of Interest. These can be specified by the user, and each of them has a numeric score which is the probability that a person will look somewhere within that area during the pre-attentive period. We did not use this feature.
Heatmap. This is a color-coded probability map that a certain part of the image will attract the gaze during the pre-attentive period. We used this feature in all the scans, adopting it as the most direct and useful diagnostic tool for our analysis.
Hotspots. A simplified version of the heatmap results shows only the areas that are most likely to be seen during the pre-attentive scan, with a numeric score indicating the probability that a person will look somewhere in that region during the pre-attentive period.
Gaze Sequence. This indicates the four most likely gaze locations, in their most probable viewing order.
Visual Features. This visualization gives an insight to how the algorithm works, by extracting those same features that drive pre-attentive processing in our visual system [25]; namely edges, intensity, red/green color contrast, blue/yellow color contrast, and faces. We used this feature only in the first scan, for demonstration purposes.
Buildings and patterns of interest of either the same or of different photographs were used for scanning. Some of the images were cropped parts of the same photograph. Image selection and comparison among the results aimed both to derive general practical results, and to learn how best to use the 3M-VAS software.
We scanned different building types. Following on from the recent pilot study by two of the present authors [2], here we went one step further to examine the contribution of more elements, in addition to window size, shape, and arrangement. We undertook a series of scanning experiments to robustly understand the interaction of image and subject, and how that depends upon various factors. These trials shed light on how to technically optimize the conditions for analysis, as follows.
i.Framing: Adding a surrounding frame, when the building of interest occupies most of the photographic field.ii.Brightness/contrast/saturation: Adjusting these parameters, either overall or locally, influences the way that the software registers the examined structures.iii.Distance from the building: Examining whether approaching a structure reveals more details, resulting in sustained coherence, or if the coherence disintegrates.
In the building photographs, cropping was performed only to isolate specific features when needed; in all other cases there was no effort to exclude elements like people or cars, as we wanted to be able to experiment with real-life images. Since what is described here is a novel material, it was equally important to investigate how to avoid pitfalls, which is connected to but distinct from the above points. This is a significant challenge. Failure to optimize some of the image parameters may give scans that could lead to erroneous conclusions. We believe that our results, obtained after interpreting a large number of scans, help attribute scanning behavior to the presence of specific patterns.
5. Results
Figure 1, using a photograph from the center of Manchester, UK at the junction of Market and Cross Streets, shows the full analysis output of the 3M-VAS software. In subsequent scans not all data will be shown. Here, we see a typical situation in real street scenes: minimalist glass-façade buildings are more or less ignored, despite their dominant size. The neoclassical building of the Royal Exchange Theatre from the 1860s on the left is practically the sole focus of pre-attentive attraction, with main “hotspots” in areas of rich detail. There is also some attraction to the road level with people and cars, to the edge of a cloud and, to a much lesser degree, to some reflections and other areas of contrast in the modernist-style buildings. As analyzed by the software, the edges, which are represented by sharp intensity contrasts, are the most important parameters in this case. The shaded area of the building does not attract, hence it is not well represented in the heat map (this is an artifact of the software, which privileges better-illuminated portions of a visual).
In Figure 2, we used a photograph of the Certosa di Pavia monastery church in Pavia, Italy. The entrance door and windows are logical hotspots, and the heatmap covers all of the building. In the first row (A/B) the software ignores the wing on the right because it is in shadow. But this limitation is easily circumvented. In the second row (C/D), artificially increasing the brightness and contrast of this part in shadow makes its details more visible to the software, and now the wing on the right is also part of the heatmap area. This example establishes one of the key results of these scanning experiments: a high degree of organized complexity achieved through nested symmetries engages the viewer. Our subsequent studies reveal that departures from this mathematical state by losing organization, or complexity, or both, lose the viewer’s unconscious interest.
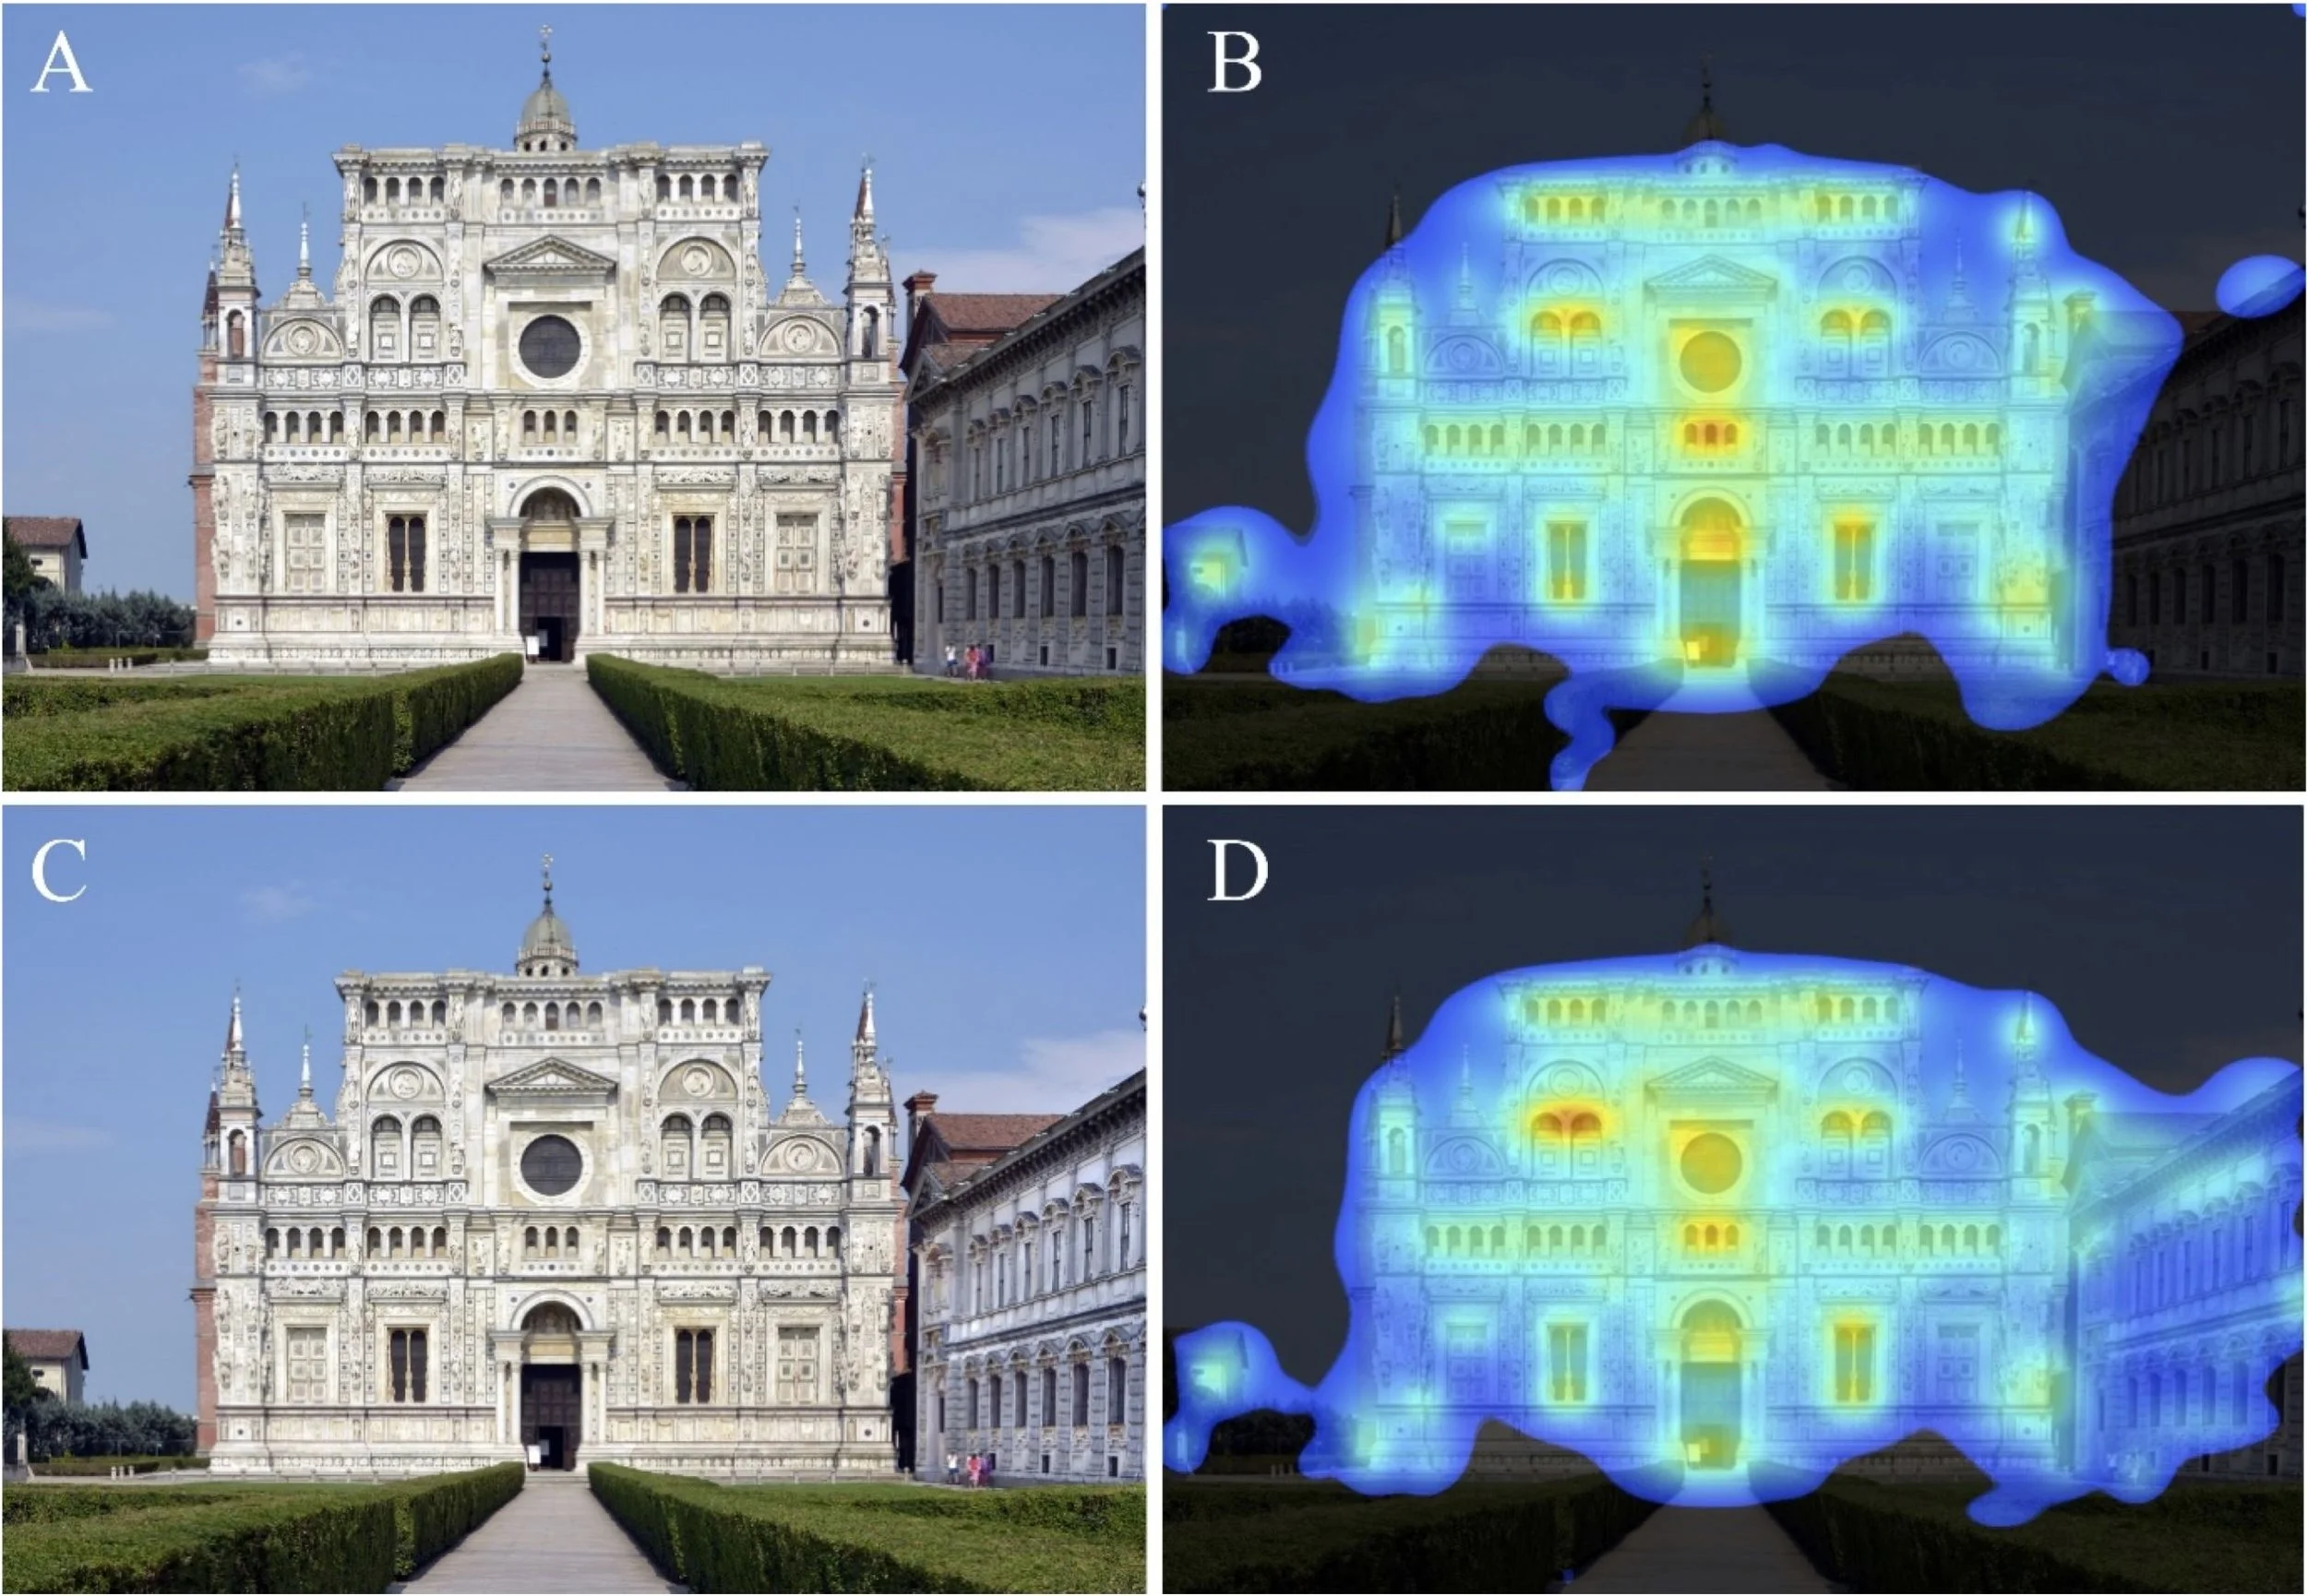
Figure 2. The church of the Certosa di Pavia monastery in Pavia, Italy. (A), original photograph; (B) visual attention heatmap misses the part of the building in shadow; (C), the same photograph after increasing the brightness and contrast of the wing that is in shadow; (D) the visual attention heatmap of adjusted visual now includes the part of the building originally in shadow.
Figure 3 analyzes a color photograph of a 1920s building with a glass façade building directly behind it in Hasanabad square, Tehran, Iran (A/B); and a black and white photograph of an 1830s building with a glass façade directly behind it in Panepistimiou Street in Athens, Greece (C/D). The old buildings are of different styles, and the two photos also differ in that one is in color and the other one in black and white. However, the comparative results are identical, with the glass façade behind completely ignored in each case, while the heatmap distributes practically over the whole pre-modern building, with hotspots at windows or other appropriate structural details.
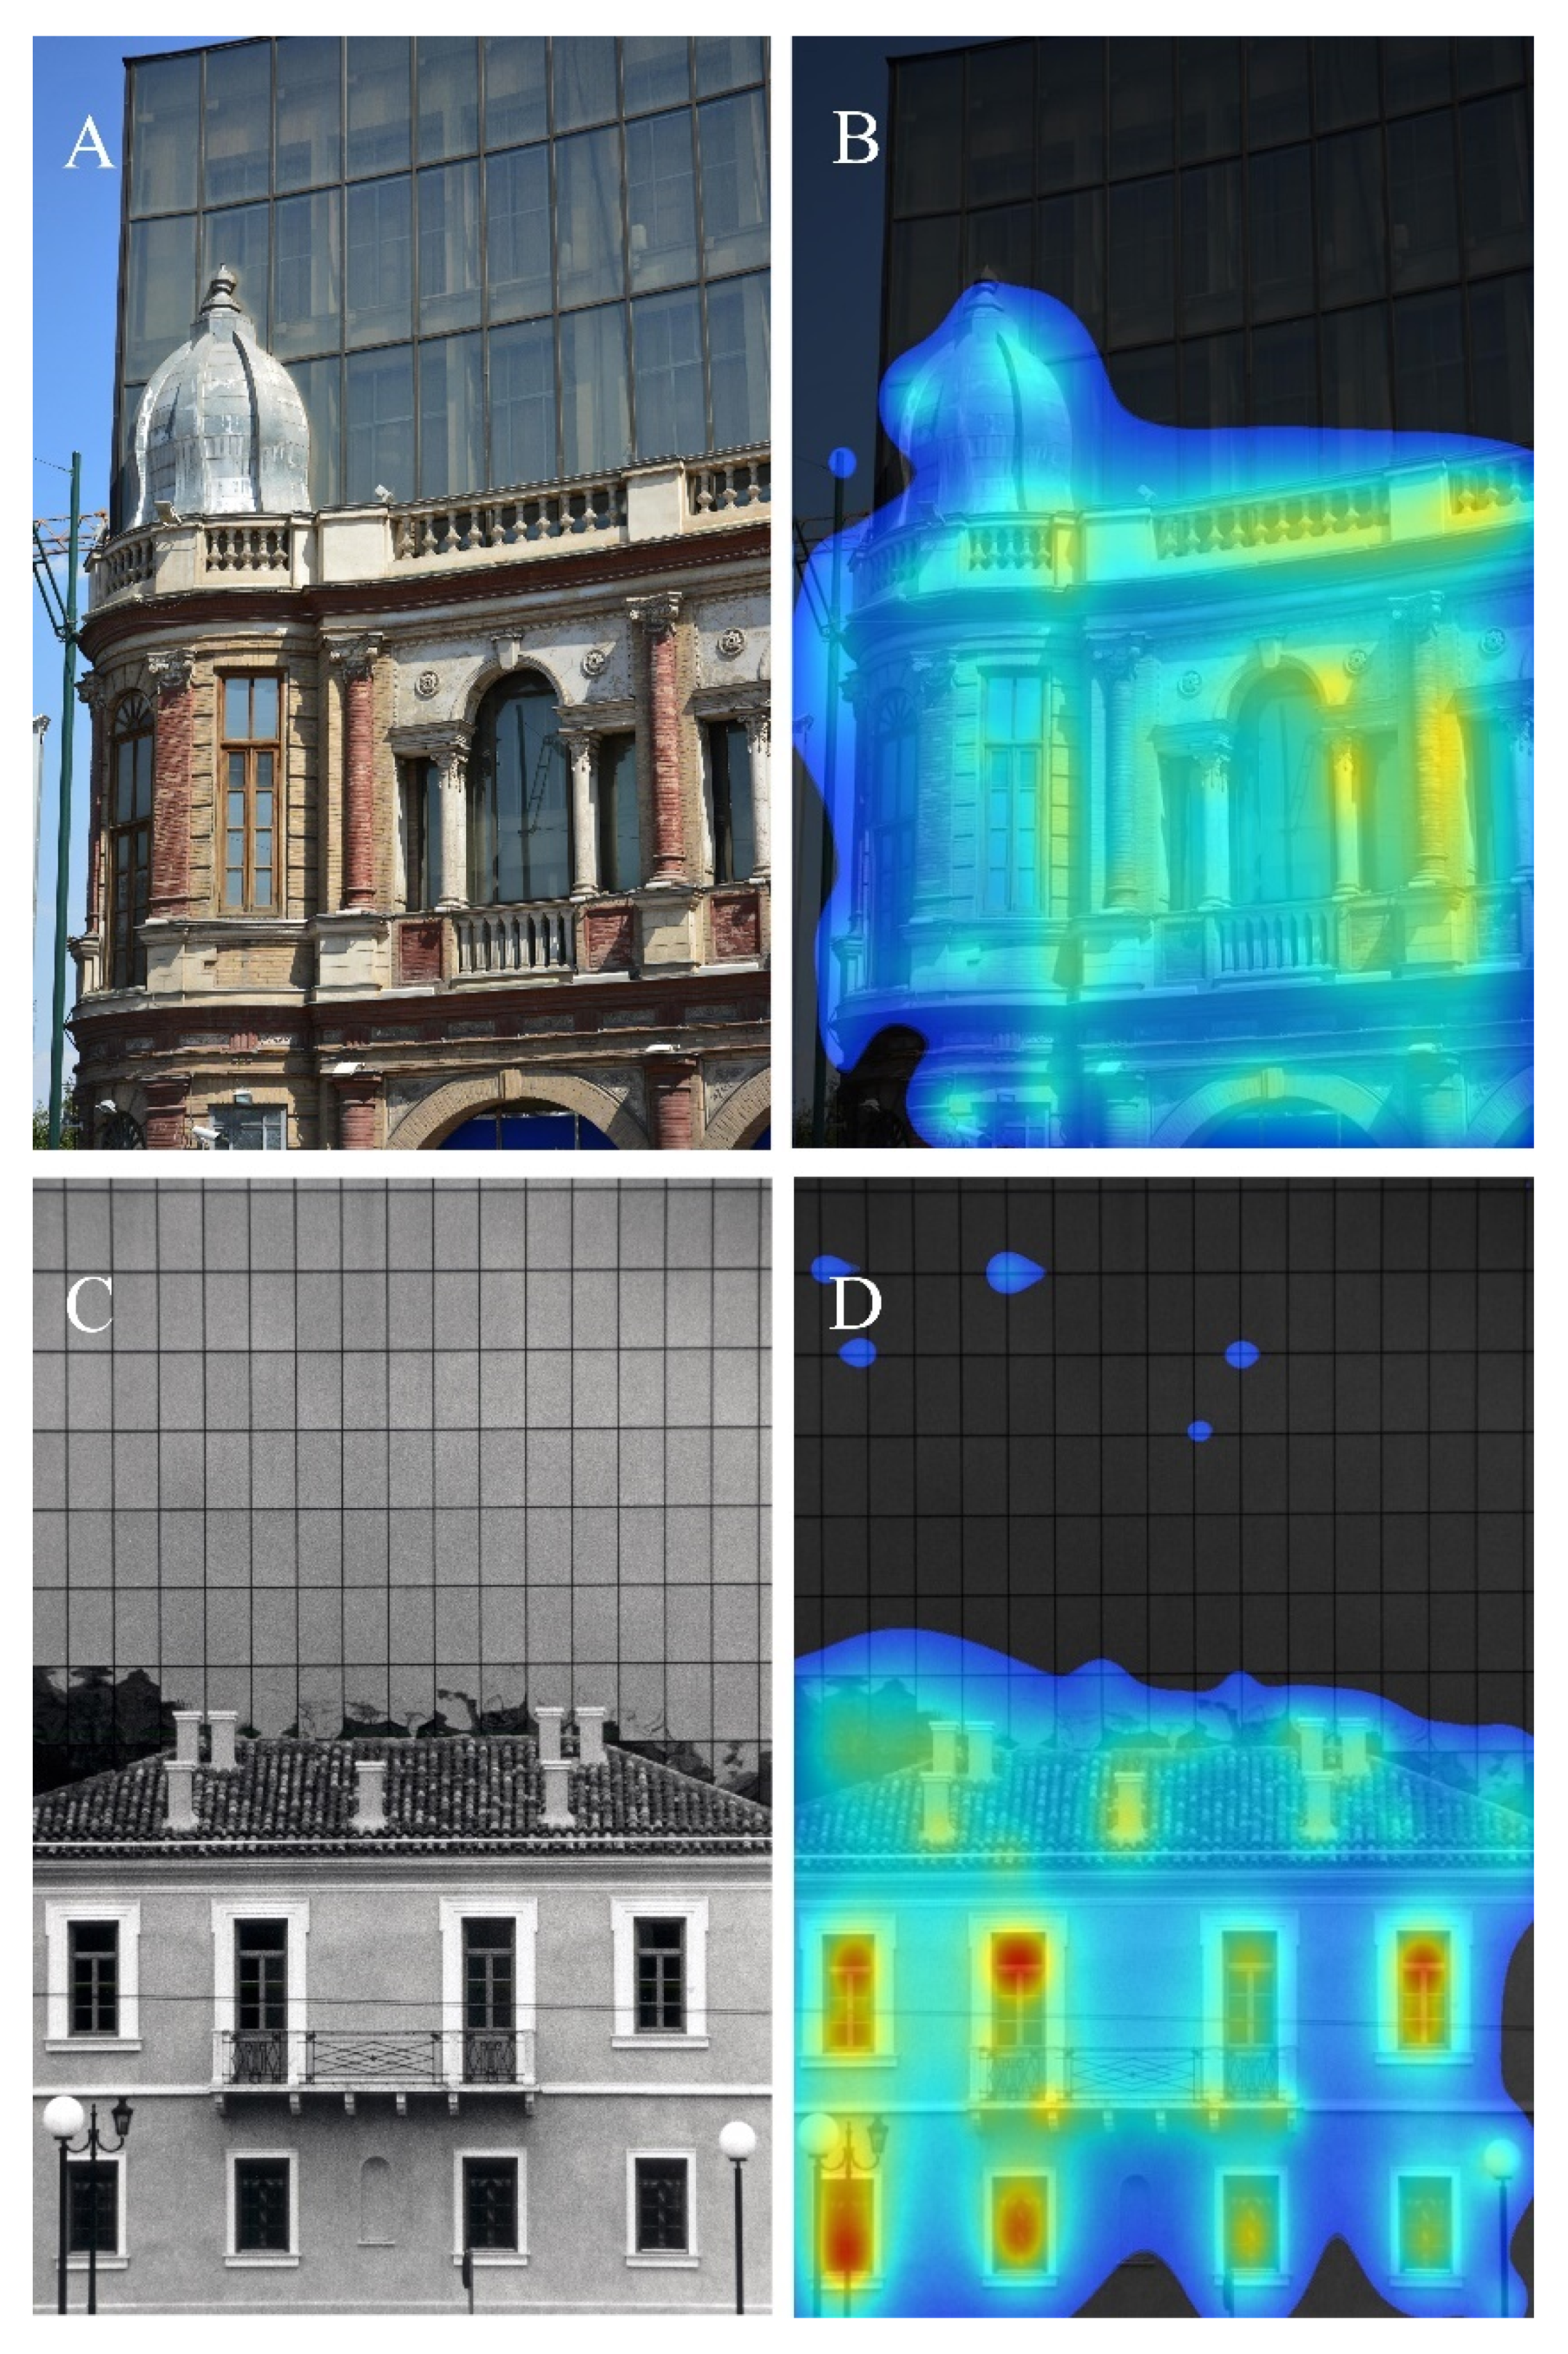
Figure 3. A 1920s building with a glass façade building directly behind it, in Hasanabad square, Tehran, Iran in a color image (A,B); and an 1830s building with a glass façade directly behind it in Panepistimiou Street in Athens, Greece in a black and white image (C,D).
In Figure 4, the Omega Palace department store building from the 2000s connects to the House of Four Giants from the 1900s, in Freedom Square in Brno, Czech Republic (A/B); and the 1880s Louis Bank of Commerce building on 5th Avenue, San Diego, California is in front of a more recent building with symmetric distribution of openings in the background (C/D). In both cases, the gaze is attracted to the pre-modern building, but unlike what we see in Figure 3, a small part of the heatmap also extends to the newer building.
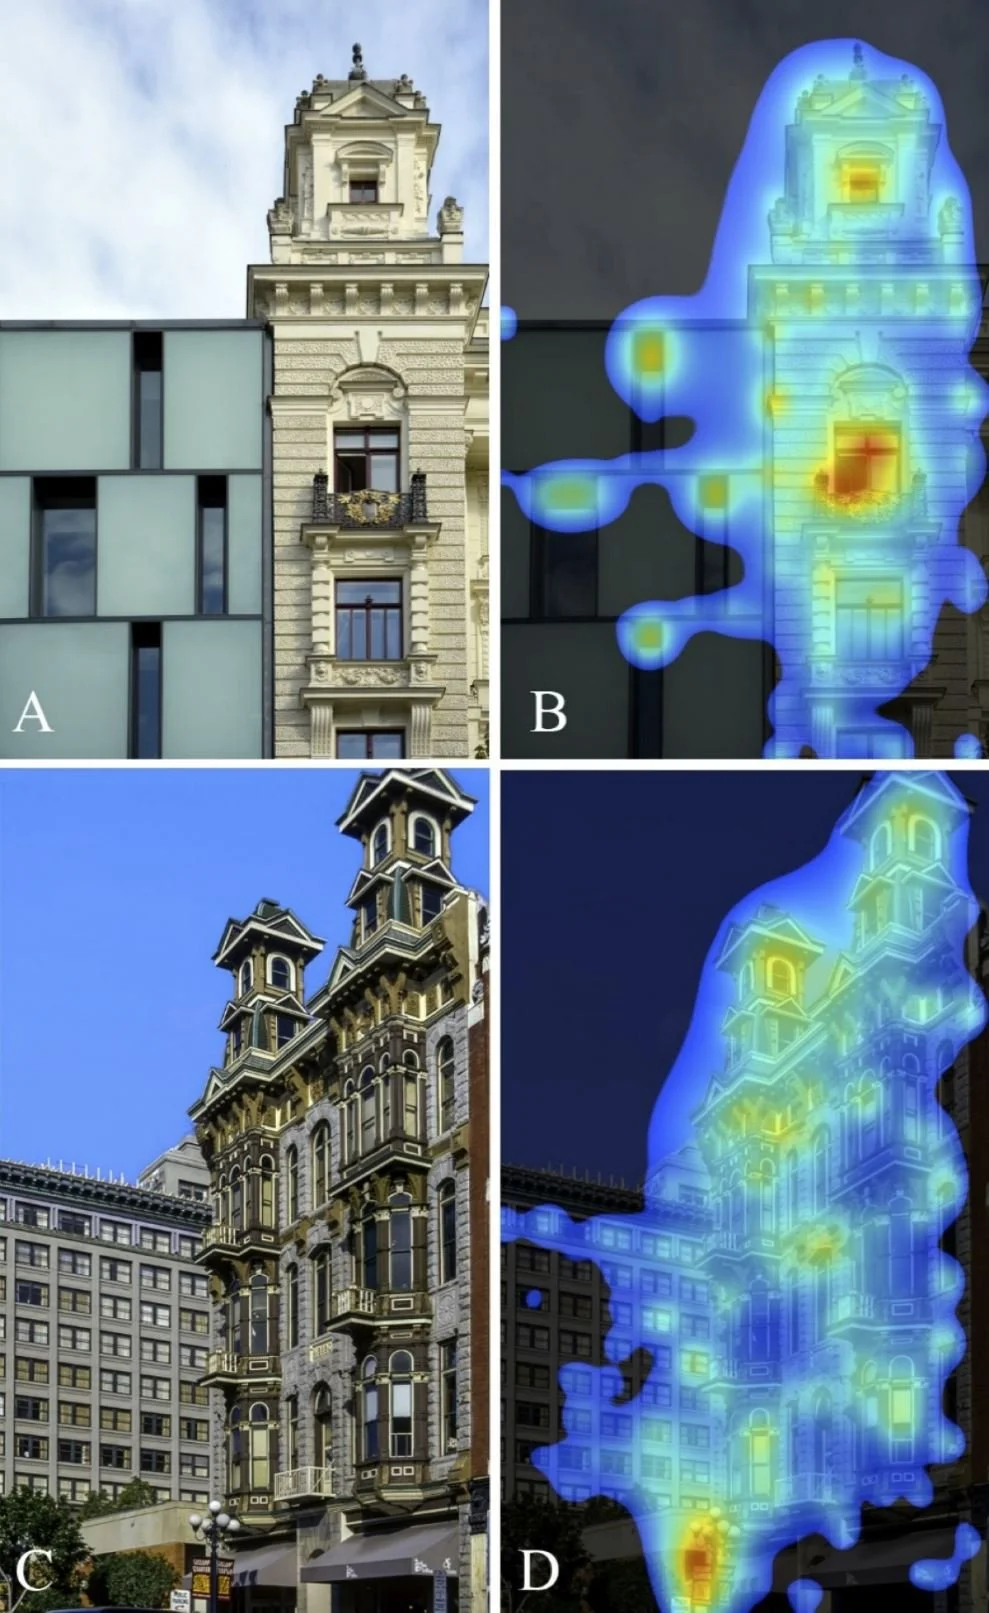
Figure 4. The Omega Palace department store building from the 2000s (left) and the House of Four Giants from the 1900s (right), in Freedom Square in Brno, Czech Republic (A,B); and the 1880s Louis Bank of Commerce building on 5th Avenue, San Diego, California with a modern building with symmetric distribution of openings in the background (C,D).
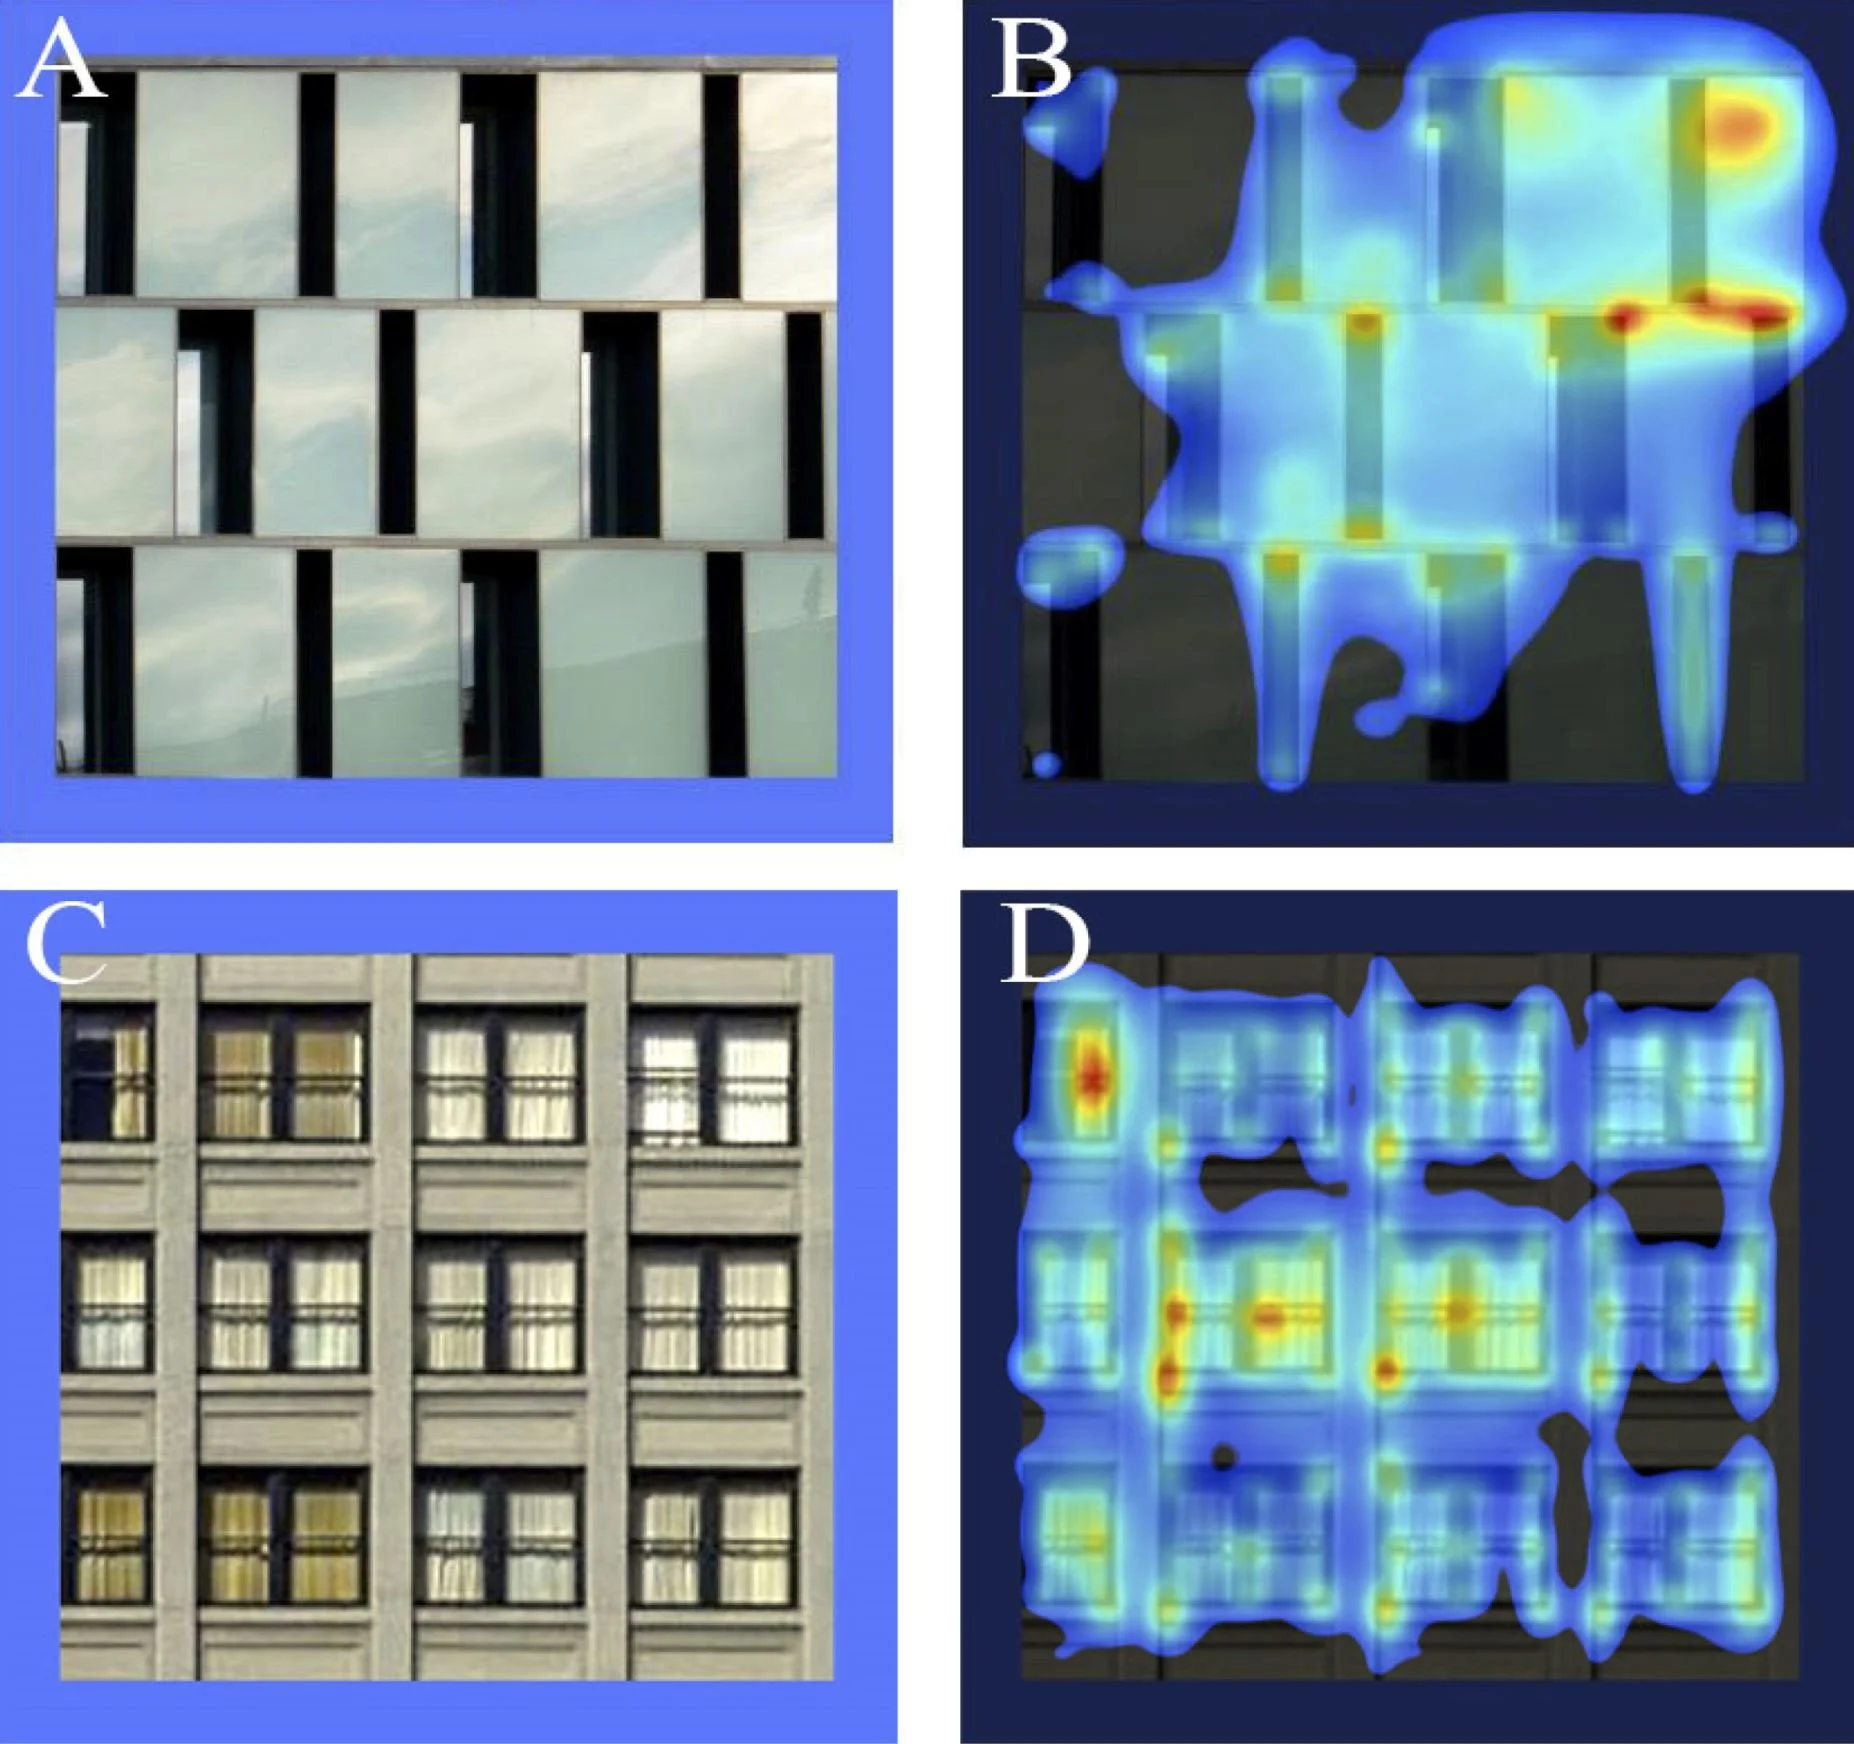
Figure 5 shows partial, equal size views of the modernist-style buildings in Figure 4 isolated from their more traditional neighbors. The glass façade building from Brno (A/B) contains some hotspots where the reflections from the sky are brighter and the contrasts with the shadows are more pronounced, but its heatmap has many gaps. Because this façade’s design pursues a visual style that deliberately eliminates nested symmetries, the gaze interest becomes fragmented [2]. The building from San Diego (C/D), although not ornate, has a regular distribution of windows, and each window is framed in an easily recognizable way. The single railing behind every window, and the shadow it casts on the curtains, create another point of regularly spaced points of contrast. All this tectonic sub-structure results in a more even distribution of the pre-attentive gaze heatmap.